Introduction
This guide will show you how to setup decent network or resource monitoring, with minimum effort.
From the author's perspective, Glances is similar to vim in the world of monitoring tools.
About glances
Glances is an open source system cross-platform monitoring tool. It allows real-time monitoring of various aspects of your system such as CPU, memory, disk, network usage, and more. It also allows monitoring of running processes, logged in users, temperatures, voltages, fan speeds, and so on. It also supports container monitoring and different container management systems, such as Docker and LXC. A dashboard presents the information in an easy to read manner, and can also perform remote monitoring of systems by way of a web, or command line interface. It is easy to install and use, and is customizable to show only the information that interests you.
Prerequisite
- A server or container
- Root privileges
- EPEL repository installed
Installing packages
First, install the EPEL repository (Extra Packages for Enterprise Linux):
dnf install -y epel-release
Next, install Glances
dnf install -y glances
You can now monitor everything you need.
Type glances to start glances.
Web interface
You can access glances even with a web browser, you just need to pass one flag -w:
glances -w
Once you send this, you will see:
Glances Web User Interface started on http://0.0.0.0:61208/
You can access it with an IP address, or just reverse proxy it to the domain name.
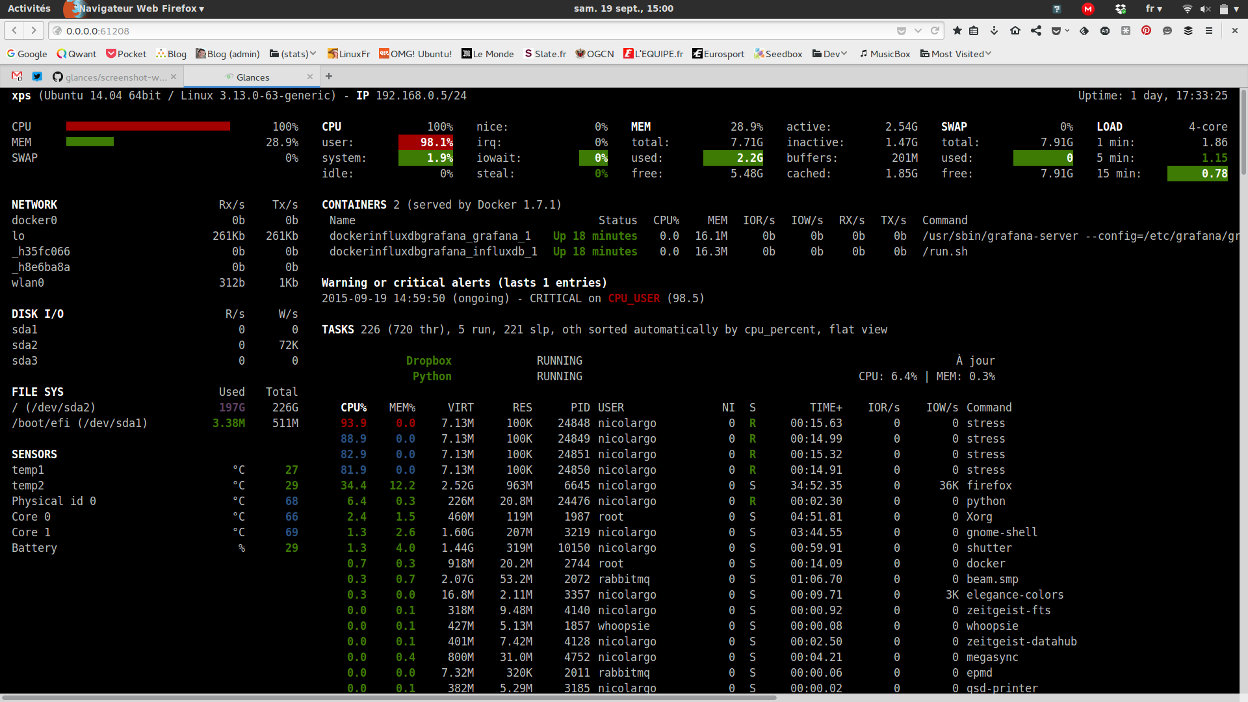
What Glances looks like
By default, you can see all your network interfaces, load average, load graphs, containers, alerts, and processes.

Interactive commands
The full potential of Glances is in its shortcuts, as it hides many network metrics by default.
The following commands (key pressed) are supported while in Glances:
- Enter : Set the process filter
Note
On macOS, use Ctrl+H to delete filter.
The filter is a regular expression pattern:
gnome: matches all processes starting with thegnomestring.*gnome.*: matches all processes containing thegnomestringa, Sort process list automatically
If CPU
>70%, sort processes by CPU usage- If MEM
>70%, sort processes by MEM usage - If CPU iowait
>60%, sort processes by I/O read and write - A, enable or disable the Application Monitoring Process
- b, Switch between bit/s or Byte/s for network I/O
- B, View disk I/O counters per second
- c, Sort processes by CPU usage
- C, Enable or disable cloud stats
- d, Show or hide disk I/O stats
- D, Enable or disable Docker stats
- e, Enable or disable to extended stats
- E, Erase the current process filter
- f, Show or hide system and folder monitoring stats
- F, Switch between file system used and free space
- g, Generate graphs for current history
- G, Enable or disable GPU stats
- h, Show or hide the help screen
- i, Sort processes by I/O rate
- I, Show or hide IP module
+, Increase selected process nice level / Lower the priority (need right) - Only in standalone mode.-, Decrease selected process nice level / Higher the priority (need right) - Only in standalone mode.- k, Kill selected process (need right) - Only in standalone mode.
- K, Show or hide TCP connection
- l, Show or hide log messages
- m, Sort processes by MEM usage
- M, Reset processes summary min/max
- n, Show or hide network stats
- N, Show or hide current time
- p, Sort processes by name
- P, Enable or disable ports stats
- q or Esc or Ctrl+C, Quit the current Glances session
- Q, Show or hide IRQ module
- r, Reset history
- R, Show or hide RAID plugin
- s, Show or hide sensors stats
- S, Enable or disable spark lines
- t, Sort process by CPU times (TIME+)
- T, View network I/O as a combination
- u, Sort processes by USER
- U, View cumulative network I/O
- w, Delete finished warning log messages
- W, Show or hide Wifi module
- x, Delete finished warning and critical log messages
- z, Show or hide processes stats
- 0, Enable or disable Irix/Solaris mode. Divides the task's CPU usage by the total number of CPUs
- 1, Switch between global CPU and per-CPU stats
- 2, Enable or disable the left sidebar
- 3, Enable or disable the quick look module
- 4, Enable or disable the quick look and load module
- 5, Enable or disable the top menu (QuickLook, CPU, MEM, SWAP, and LOAD)
- 6, Enable or disable mean GPU mode
- 9, Switch UI them between black and white
- /, Switch between process command line or command name
- F5 or Ctrl+R, Refresh user interface
- Left, Navigation left through the process sort
- Right, Navigation right through the process sort
- Up, Up in the processes list
- Down, Down in the processes list
In the Glances client browser (accessible through the --browser command line argument):
- Enter, Run the selected server
- Up, Up in the servers list
- Down, Down in the servers list
- Q or Esc, Quit Glances
Conclusion
While Glances cannot exactly replace tools such as Grafana, it is still a great alternative if you do not have time to set up complicated monitoring dashboards. You can deploy it in seconds and get the same metrics you get in Grafana with Prometheus. The web interface is not very versatile, like it is in Grafana. If you have the option to use the terminal, you should definitely do so.
Author: Alex Zolotarov
Contributors: Steven Spencer